Chapter 4 Missing values
We will first make a visna plot for the transformed dataset, which provides a good first overview of the missing values:

Here we only show the most frequent 15 patterns as the number of patterns in total is huge and most of the patterns only have a few occurrences.
By investigating the above plot, we found there are a lot of missing data for the average speed of the car per day, so we are considering removing it, as the huge missing of the data would make the result based on it unreliable.
Half of the rows in the data have no missing data except for the average speed, but the rest half have very different kinds of missing patterns.
We also noticed that the rest of the missing data are mostly from the vehicle count data(count-per-hour) for different periods during a day, so we decided to do more investigation focus on them to understand these missing patterns.
Regrading to count-per-hour data, we noticed that most of the missing patterns would have missing data for a continuous-time interval(ex. 7 pm, 8 pm, 9 pm .etc). We suspect that this may be because the data are collected for a continuous hour period (eg. 24/36/48 continuous hours), so the hours without any counting are often continuous.
To do more investigation focus on count-per-hour data, we first made a bar plot to check the trend of number of missing value with time.

For the count for different time interval, it seems that there are more missing of the data from 7am to 7pm, but the number of missing data does not different by a lot for each time interval.
Then we further made the plots showing the missing value for specific time period and date for each count session.
## [1] "English_United States.1252"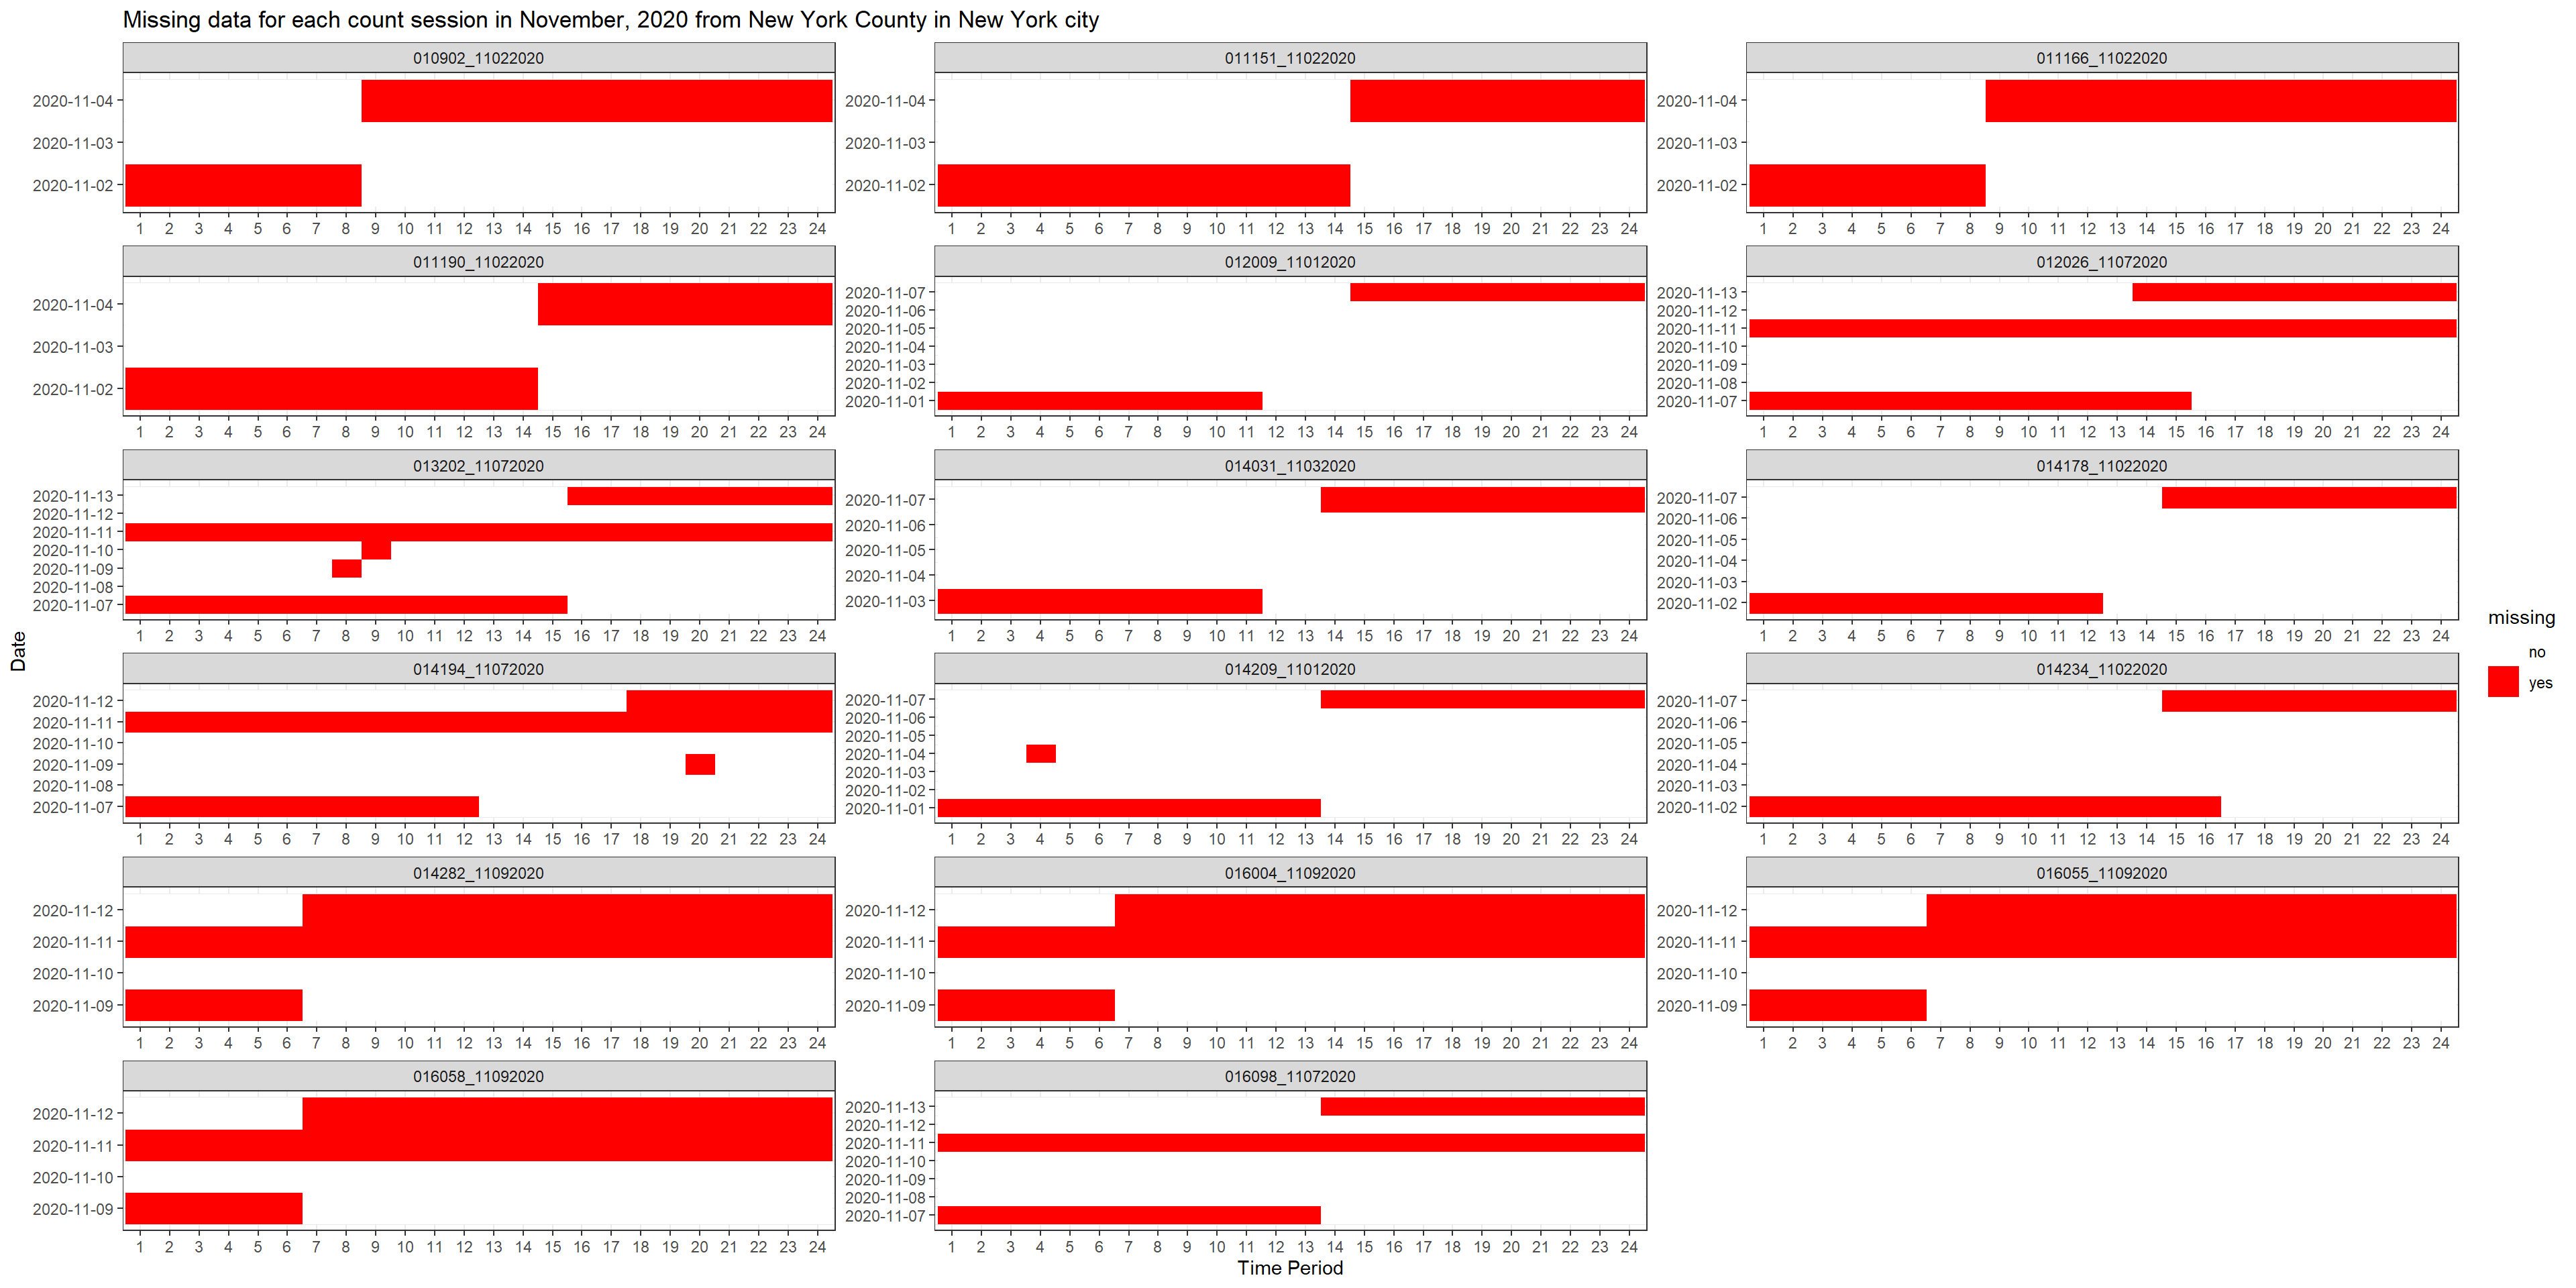
We made many plots as above, and here we use the count session in November 2020 from New York County in New York City as an example.
By using the many plots just as the above, we can easily find, for each count session, it counts the volume of cars for continuous hours and it is recorded as a whole day even not all the hours in that day are counted. This leads to the majority of missing data in the dataset as the rest of the hours during the day(red area) are recorded as NA.
Also, we indeed found some random missing value that does not follow this pattern, but they are much less frequent. After checking the documentation, there is no explanation for these missing values, so we wound treat them as errors.